๐Ÿšข Mazagon Dock Q4 & FY25 Results: Order Book, Margins, Valuations & Outlook | Profit From It
1800 890 4317
profitfromit1@gmail.com
Whatsapp

๐Ÿšข Mazagon Dock Q4 & FY25 Results: Order Book, Margins, Valuations & Outlook

Created by Piyush Patel_ in Company Update Visit: 143 4 Jun 2025
Share

๐Ÿšข Mazagon Dock Q4 & FY25 Results: Order Book, Margins, Valuations & Outlook

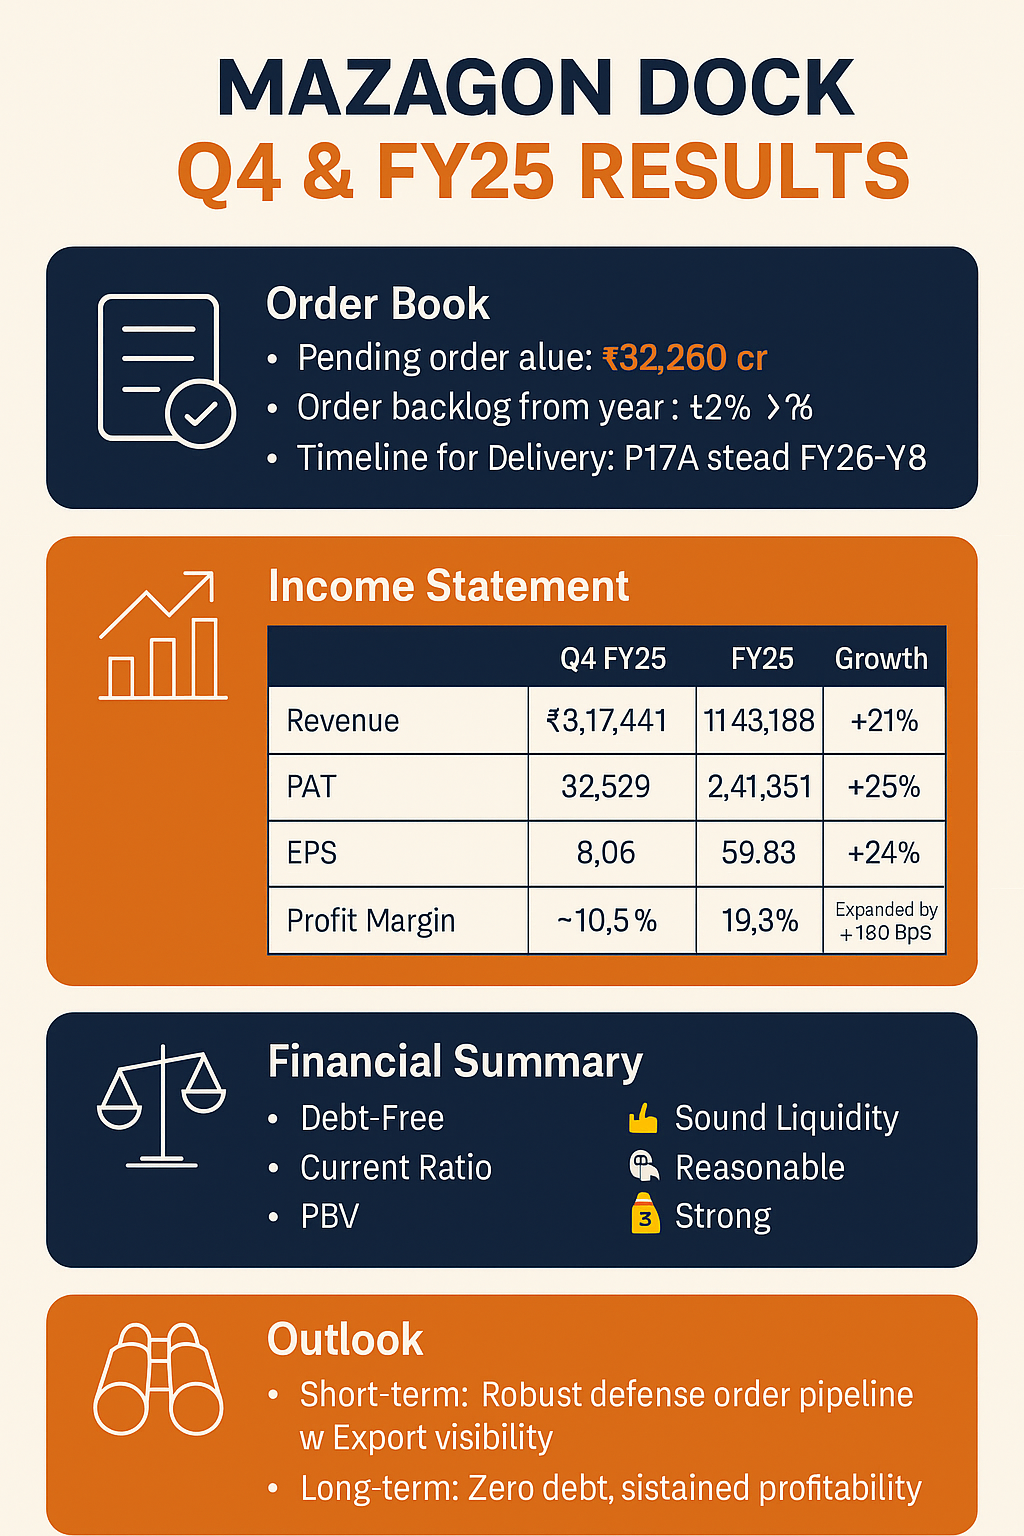
Mazagon Dock Shipbuilders Ltd. (MDL) has delivered a resilient performance in Q4 and FY25, reinforcing its position as a monopoly player in Indiaโ€™s defence shipbuilding space. From multi-decade profit consistency to a robust order book, here's everything investors need to know.


๐Ÿ”จ Order Book Update (as on 31st March 2025)

Project Type

Client

Value (โ‚น Cr)

Pending Delivery (Nos)

Order Balance (โ‚น Cr)

P17A Frigates

MoD

28,769

3

13,493

P15B Destroyers

MoD

27,120

3

13,493

Kalvari Submarines

MoD

2,849

21

2,829

ONGC Projects (PRPP, DSF II)

ONGC

6,524

3

5,409

Hybrid Vessels (Export)

Europe

~710 Cr (USD 85 Mn)

6

710 (approx)

Total Order Book

โ€”

โ€”

โ€”

โ‚น32,260 Cr

โณ Delivery timeline: Stealth frigates and destroyers expected to be completed over FY26โ€“FY28, export orders underway.


๐Ÿ“Š Consolidated Income Statement (โ‚น in Lakhs)

Metric

Q4 FY25

FY25

YoY Growth

Revenue from Operations

3,17,441

11,43,188

+21%

Total Income

3,48,392

12,55,311

+19%

EBITDA

42,653

1,70,920

+26%

PAT

32,529

2,41,351

+25%

EPS (โ‚น)

8.06

59.83

+24%

EBITDA Margin

~13.4%

~13.8%

Expanded by +80 bps

Profit Margin

10.5%

19.3%

Expanded by +180 bps

PE Ratio (CMP โ‚น3439)

โ€”

57.5x

โš ๏ธ Premium Valuation

Interest Coverage Ratio

โ€”

25.4x

โœ… Very Healthy


๐Ÿ“Š Balance Sheet & Key Ratios (FY25 Consolidated)

Metric

Value

Ratio/Status

Net Worth

โ‚น7,93,988 lakh

Strong

Cash & Equivalents

โ‚น5,28,539 lakh

Highly Liquid

Trade Receivables

โ‚น2,08,820 lakh

~25% of assets

Debt-to-Equity

0.00x

โœ… Debt-Free

Current Ratio

2.15x

โœ… Sound Liquidity

PBV (Price to Book)

2.1x

Reasonable


๐Ÿ’ฐ Cash Flow Summary (FY25 Consolidated)

Metric

Value (โ‚น lakh)

Commentary

CFO

โ‚น2,07,805

Strong Operating Cash

CFI

โ‚น(1,29,910)

Capex + FDs

CFF

โ‚น(71,204)

Dividend payout of โ‚น20.65/share

Net Cash Flow

โ‚น6,691

Slightly positive

Free Cash Flow (Est.)

~โ‚น1,35,000

Strong reinvestment potential


๐Ÿ“ˆ Performance Snapshot (Standalone)

Indicator

FY25

FY24

Revenue

โ‚น11,432 Cr

โ‚น9,467 Cr

EBITDA

โ‚น3,229 Cr

โ‚น2,550 Cr

PAT

โ‚น2,325 Cr

โ‚น1,845 Cr

EPS

โ‚น57.63

โ‚น45.75


๐Ÿง  Strategic & Operational Highlights

  • ๐Ÿ‡ฎ๐Ÿ‡ณ Navratna Status awarded in FY25

  • ๐Ÿ›ฅ Delivered 3 front-line warships on a single day: INS Surat, INS Nilgiri & INS Vaghsheer

  • ๐ŸŒŠ Capacity to build 11 submarines & 10 warships simultaneously

  • ๐ŸŒ Export orders secured from Europe โ€” โ‚น710+ Cr in hybrid vessels

  • ๐Ÿ’ก Launched Hydrogen Fuel Cell Boat & Solar-Electric Boat โ€“ focus on sustainability


๐Ÿงพ Dividend History (Declared Basis)

FY

Dividend per Share (โ‚น)

Total Dividend (โ‚น Cr)

2024โ€“25

โ‚น20.65

โ‚น832.98

2023โ€“24

โ‚น13.72

โ‚น553.64

2022โ€“23

โ‚น7.98

โ‚น321.90


๐Ÿ“Œ Outlook: What Should Investors Expect?

๐Ÿ“† Short-Term

  • Healthy execution pipeline across P17A and P15B warships

  • Strong visibility in export contracts, MRO, and ONGC EPC projects

๐Ÿ”ฎ Long-Term

  • Leadership in Indiaโ€™s defence shipbuilding under Make in India

  • High ROE, consistent profitability, and zero debt = strong fundamentals

  • New land acquisition + infra expansion = potential capacity boost


๐Ÿ“„ Disclosure:

This analysis is for educational purposes only. It is based on publicly available financial reports and investor presentations. Investors are advised to conduct their own due diligence before making any investment decisions.


Comments (0)

Share

Share this post with others