
Listen to this Blog
🏢 REITs in India: A Complete Investor Guide – Comparison, Insights & Global Benchmarks
📅 Published: April 2025
✍️ By: ProfitFromIt
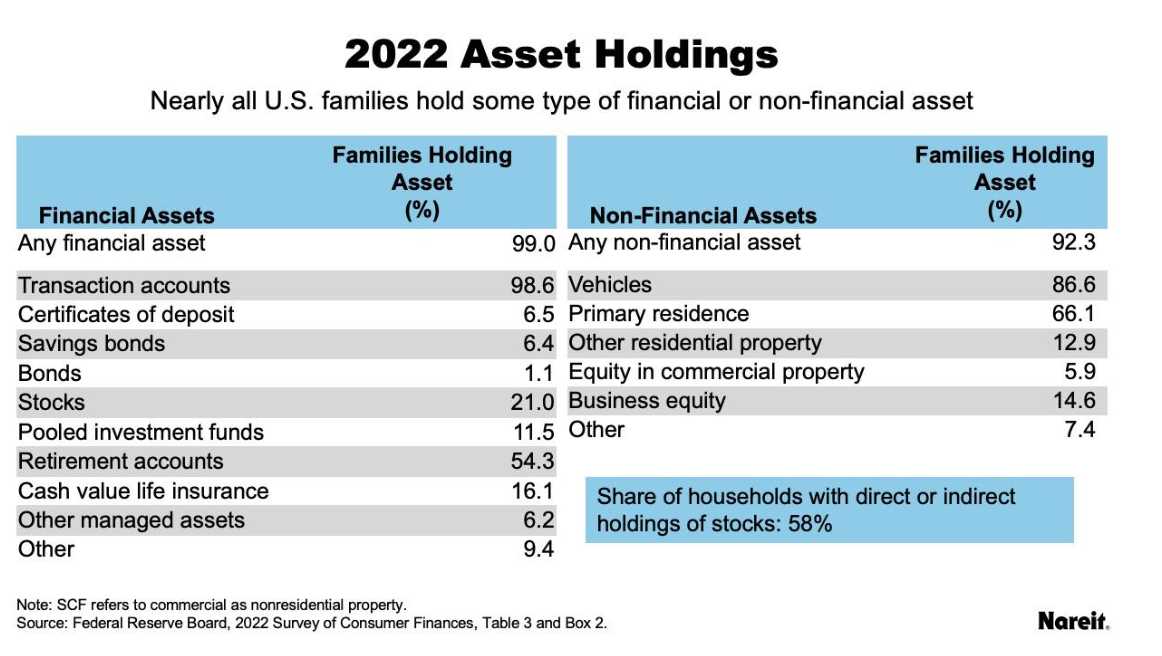
📘 What Are REITs?
REITs (Real Estate Investment Trusts) are companies that own and operate income-generating commercial real estate, such as:
Office buildings
Shopping malls
Warehouses
Data centers
REITs allow investors to buy shares of property portfolios — just like stocks — and earn:
💸 Regular rental income (dividends)
📈 Long-term capital appreciation
Ideal for Retired Investors looking for Regular Income.
💡 Why Should You Invest in REITs?
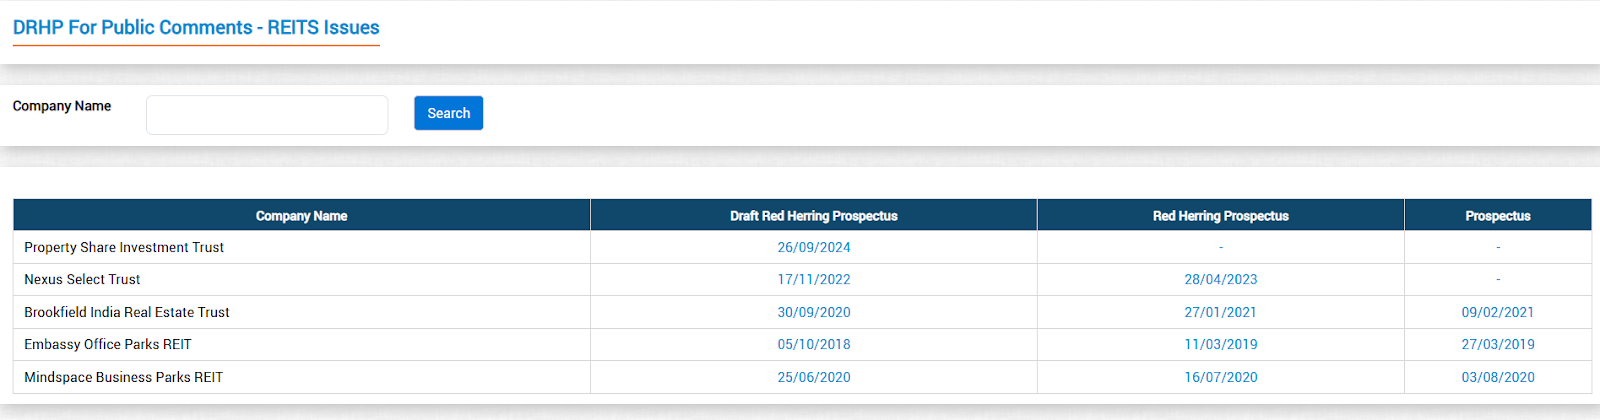
🇮🇳 Top 3 Listed REITs in India (as of 2025)
📥 Download Detailed Excel Comparison
🌎 How Do Indian REITs Compare Globally?
We analyzed major international REITs like:
🇺🇸 Realty Income Corp (USA)
🇸🇬 CapitaLand CICT (Singapore)
🇦🇺 Dexus (Australia)
🇭🇰 Link REIT (Hong Kong)
🔍 REIT KPI Comparison (India vs Global)
📥 Download Global vs Indian REIT KPI Excel
🔬 Key Metrics Explained
✅ Price to FFO (Funds From Operations)
Similar to P/E ratio in stocks
Shows how expensive a REIT is based on its actual rental cash flow
Lower P/FFO (10–16) is generally more attractive
✅ NAV Premium/Discount (%)
Tells you if REIT is over/undervalued vs its property value
Buy at a discount = better margin of safety
✅ Dividend Yield
Indicates annual income return
REITs offering 5–6%+ yield with strong tenants are favorable
🚀 Future Prospects for REITs in India
⚠️ Risks to Consider
✅ Should You Invest?
📌 Final Checklist Before Investing in a REIT
✅ Check occupancy rate >85%
✅ Look for stable tenants (MNCs, banks)
✅ Analyze debt ratios (LTV <40%)
✅ Compare P/FFO & NAV Discount
✅ Understand dividend history & payout policy
🛠️ Tools to Help You Start
📦 📊 Indian REITs Comparison & Template (Excel)
🌎 🌐 Global vs Indian REITs KPI Dashboard (Excel)
📢 Disclosure
This blog is intended for educational purposes only. It is not investment advice. Past performance of REITs does not guarantee future returns.
📞 Need Help?
Want to analyze REITs for your portfolio or include them in your retirement plan?
📩 Contact us at: WWW.PROFITFROMIT.CO.IN


.jpg)


