
📊 Market Favorability Score (MFS):
A Smarter Way to Allocate Equity vs Cash in Indian Markets
🔍 What if you could objectively decide how much equity to hold based on real, historical market signals?
In an age where headlines often steer investor emotions, it's crucial to have a quantitative framework rooted in macroeconomic and valuation indicators. That’s where the Market Favorability Score (MFS) comes in — a data-driven tool that brings structure to allocation decisions, especially when navigating volatile or euphoric markets.
As investors, we often rely on gut feel, emotions, or scattered news to make portfolio decisions. But what if we turned to data-driven history, evaluating core economic and market indicators like GDP Growth, Inflation, Repo Rate, Nifty PE, and PBV to assess where the market truly stands?
Markets don’t exist in a vacuum. They ebb and flow with GDP growth, inflation trends, central bank policy, and valuation metrics like P/E and PBV. Yet most allocation models ignore the nuances across cycles.
This is exactly what we've done with the Market Favorability Score (MFS) – a simple yet powerful model that helps determine your optimal equity allocation between 50% (during high risk) and 95% (during most favorable conditions).
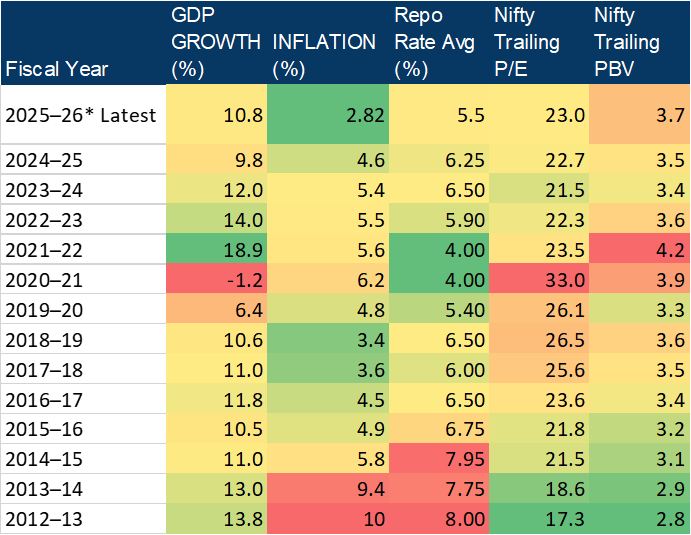
🧮 Key Indicators Used in MFS
We analyzed 13 years of historical data (FY 2012–13 to FY 2025–26*) to understand the behavior and risk zones of the following indicators:
🧠 The Core Pillars of MFS
MFS is calculated by evaluating five fundamental indicators:
Each metric is assigned a score between 0 (risk) and 1 (favour), and the average of all five becomes the MFS score, ranging between 0 and 1.
We classified historical favorable vs risky ranges:
🧮 Know Market Favorability Score:
Individual Indicator Score Formulas (0 to 1)
For Indicators where "Higher is Better" (e.g., GDP Growth): Score = (Current_Value - RISKY_Value) / (FAVOUR_Value - RISKY_Value)
GDP Growth: (10.8−(-10))/(20−10.8) = 0.69
For Indicators where "Lower is Better" (e.g., CPI Inflation, Repo Rate, NIFTY_PE, NIFTY_PBV): Score = (RISKY_Value - Current_Value) / (RISKY_Value - FAVOUR_Value)
CPI Inflation: (10−2.82)/(10−2) = 0.9
Repo Rate: (9−5.5)/(9−4) = 0.7
NIFTY_PE: (29−22.96)/(29−13) = 0.38
NIFTY_PBV: (7−3.7)/(7−2) = 0.66
Important Note on Scores: Ensure scores are capped between 0 and 1. If Current_Value goes beyond RISKY_Value or FAVOUR_Value, the score might be less than 0 or greater than 1. In a spreadsheet, use MAX(0, MIN(1, Score_P)) to ensure it stays within 0 to 1.
Here latest MFS Score comes to 0.67
🧮 Turning MFS Into a Dynamic Allocation Formula
To translate MFS into portfolio action, I use the following simple formula:
Cash_Allocation (%) = 0.50 - (MFS × 0.45)
This means:
At MFS = 0 (risk), cash holding = 50%
At MFS = 1 (favourable), cash holding = 5%
Portfolio equity exposure automatically adapts between 50%–95%
🚦 A Live Example: FY_25–26
Let’s run the current macro and valuation data through this model:
Nominal GDP: 10.8% → Favourable
Inflation: 2.8% → Highly Favourable
Repo Rate: 5.5% → Neutral to Favourable
Nifty P/E: 23x → Slightly Elevated
Nifty PBV: 3.7x → Mildly High
From these, the composite MFS score = 0.67, leading to:
Cash Allocation = 0.50 - (0.67 × 0.45) = ~20%
🟢 This suggests equity allocation of 80%, reflecting a broadly constructive but slightly cautious outlook.
🔎 Live Case Studies
✅ Case Study 1: FY 2012–13 — Hidden Opportunity Zone
➡️ Outcome:
Though inflation and repo rates were high, growth was strong and valuations were cheap.
📈 A strong re-rating of Indian equities followed in 2014–2016, delivering 15–20% CAGR returns.
✅ The MFS model guided a favorable allocation, which paid off over the next 3 years.
🟠 Case Study 2: FY 2018–19 — Valuations Frothy Despite Good Macro
➡️ Outcome:
Macro was decent, but valuations were priced in perfection.
🛡️ A slightly reduced allocation prevented overexposure just before 2020’s correction.
✅ Case Study 3: FY2020–21 – The Pandemic Crash and Recovery
Macro Snapshot:
GDP Growth: -1.2%
Inflation: 6.2%
Repo Rate: 4.00%
Nifty P/E: 33.0
Nifty PBV: 3.9
🧠 MFS Score Estimate: ~0.30 → Cash Allocation: ~36.5%
Benefit: Despite the sharp correction in March 2020, valuations rebounded aggressively, leading to frothy zones by Q4. ✅ MFS warned of elevated valuations despite policy easing, nudging a defensive cash allocation. This would have reduced exposure near the peak, cushioning drawdowns and creating dry powder for re-entry during dips.
📍 Case 4: FY2021–22 – Peak Growth, Beginning of Rate Cycle
Macro Snapshot:
GDP Growth: 18.9%
Inflation: 5.6%
Repo Rate: 4.00%
Nifty P/E: 23.5
Nifty PBV: 4.2
🧠 MFS Score Estimate: ~0.62 → Cash Allocation: ~22.1%
Benefit: Massive earnings growth came off a low base, with aggressive liquidity support. ✅ MFS showed a favourable score, but warned against extremes with valuations inching high. A moderate cash allocation preserved upside while offering protection from the coming rate hikes in 2022–23.
🧮 Backtested Edge
If an investor followed the MFS model from 2012 to 2024, dynamically adjusting equity between 50%–95%, the following outcomes could emerge:
Smoother returns during volatile years (e.g., 2015, 2018, 2020)
Capital protection in overheated valuation zones
Stronger compounding during high-growth, low-inflation cycles (e.g., 2016–17, 2023–24)
> Compared to a static 100% equity allocation, this adaptive model may have reduced drawdowns by 20–30% in volatile periods and outperformed during consistent growth phases.
📊 Benefits of Using MFS Model
✅ Avoids overexposure during speculative or overheated phases
✅ Captures favorable re-rating when growth + valuations align
✅ Disciplined & emotion-free investing approach
✅ Ideal for PMS, HNIs, long-term retail portfolios
📥 Want to Use the MFS Model?
📈 Get access to the Excel tool and plug in live GDP, inflation, repo, P/E, and PBV data
💡 See your equity-cash allocation dynamically adjust
📊 Use it monthly or quarterly to fine-tune portfolio strategy